Sensitivity analysis quantifies the variation in the outputs of a simulation model with respect to changes in simulation inputs. Using information obtained from sensitivity analysis can help determine which inputs are the most relevant and which might be neglected. Knowing which inputs are important can help highlight potential problems early, refine models to be more accurate or efficient, and narrow the search space used in design and optimization. Considering fewer factors can drastically reduce the necessary number of samples, reducing costs and saving time. These abilities make sensitivity analysis crucial when handling complex systems and creating robust solutions.
SmartUQ features two proven sensitivity analysis solutions: emulation based and generalized Polynomial Chaos Expansion (gPCE).
A simple example of a sensitivity index is the slope of a straight line. The slope is a measure of the sensitivity of y with respect to x. It is often far more difficult to determine sensitivities for more complex functions, experiments, and simulations. Inputs often have interacting effects, where a change in one input changes the sensitivity of another input, and untangling these interactions can be a complicated task.
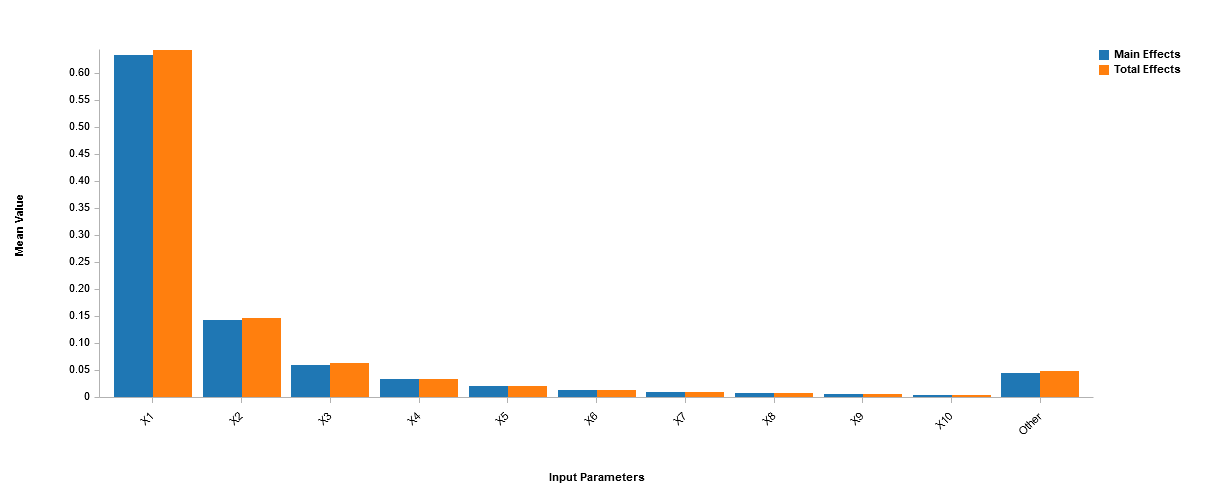
SmartUQ provides both the main and total effect sensitivity indices. The main effect index measures the influence of a single input variable on the output, but does not take into account the variable interaction with other input variables. The total effect index measures the influence of one input variable, taking into account the interactions of that variable with other input variables. Knowing the total effect indices is critical when studying non-additive systems. Using these two indices in unison can provide a more extensive measure of sensitivity across the entire parameter space.
Due to the increase in speed over more sampling intensive methods, emulator/surrogate model based sensitivity analysis has become a popular solution, especially for problems with large sample sizes, non-linear behavior, and high dimensions. Now, with the use of SmartUQ's breakthrough technology, emulator/surrogate model based sensitivity analysis can be applied to much larger problems than ever before. The easy-to-use sensitivity analysis tool in SmartUQ takes a previously constructed emulator/surrogate model and quickly provides both main effect and total effect indices for all of the inputs.
Example
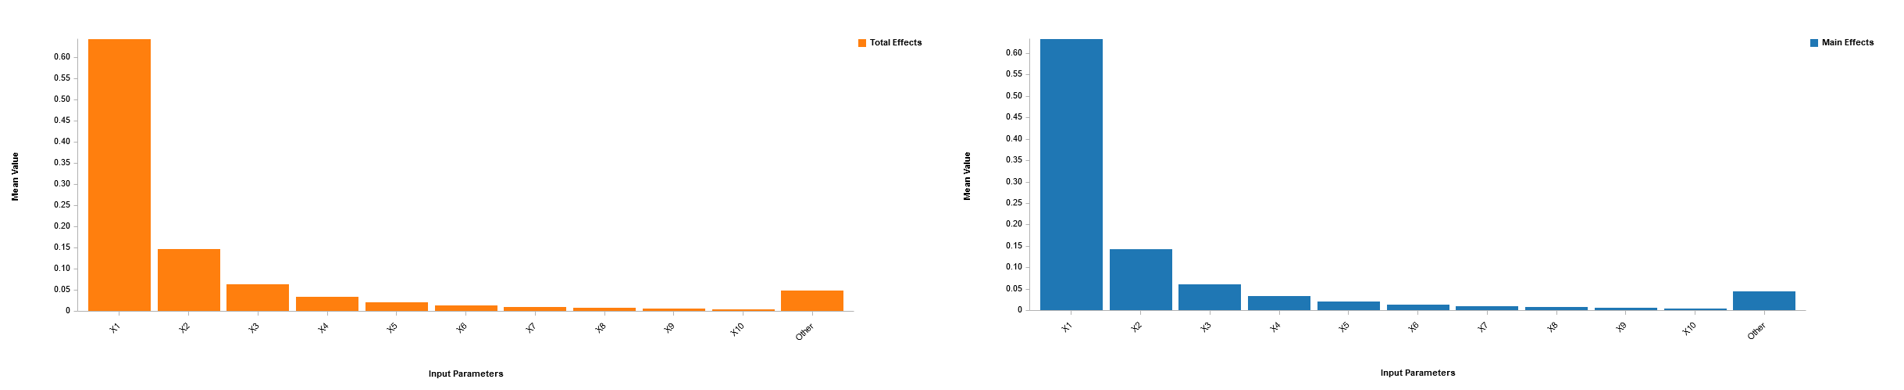 Emulator Based Sensitivity Analysis
SmartUQ features an easy to use Generalized Polynomial Chaos Expansion (gPCE) tool. gPCE is an applied mathematics technique for estimating the behavior of a system using a series of multivariate polynomials. The system to be evaluated is sampled using a sparse grid DOE and then gPCE is used to approximate the functional association between the stochastic output and each of its random inputs. This approximation is then used to calculate uncertainty propagation and sensitivity analysis results. gPCE is a highly efficient technique both in the low number of points required in the sparse grid DOEs and in the speed of calculation of the results.
For an output Y, the gPCE can be written as a series of multivariate polynomials. The multivariate polynomials are themselves comprised of one-dimensional polynomials. Each one-dimensional polynomial provides an optimal basis for different continuous probability distribution types. The optimality of each basis comes from its orthogonality with respect to the probability density function of the continuous distribution.
Example
 Generalized Polynomial Chaos Expansion Based Sensitivity Analysis
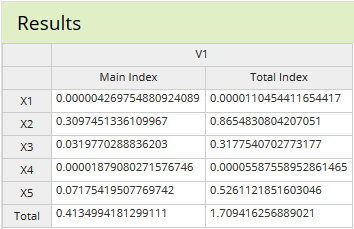
In this example, gPCE based methods were used to perform sensitivity analysis on a data set consisting of five input variables and a single output variable. The input variable probability distributions were predicted based on their expected uncertainty and this was used to generate the sparse grid design of experiments. The system was then evaluated using the design of experiments and the resulting outputs were used in the gPCE analysis. The main effects and total effects are summarized in the table. SmartUQ can even perform sensitivity analysis when sparse grid data sets have missing values.